


What is an Investor Data Room?
A Data Room is a tool for sharing key information about a company that investors or potential business partners need. It is a space where metrics and documents about a startup's operations are gathered. The Data Room can include financial documents, contracts with customers and suppliers, vision and growth strategy, data about products and services, and information about the management team. This makes it quicker and easier for investors to assess a startup's business potential and make an investment decision. The Data Room is usually password-protected and can only be accessed by a select group of people who have received an invitation to participate in the investment process. It is also important that the documents are organized and easy to find, so that those using the Data Room can quickly find the information they need.
What metrics are worth presenting to investors?
The Data Room should include metrics that will help potential investors accurately assess a company's value and growth prospects. Worth including: financial indicators: Such as income statements, financial balance sheets, cash flow and other financial reports that provide a complete picture of a company's financial performance. KPIs: Metrics that show a company's progress and growth, such as revenue growth, customer acquisition cost, customer retention and LTV. Market analysis and research: Information about the company's market size, competition and target audience. Operational metrics: Such as production costs, inventory turnover and supply chain management. Human resource metrics: Such as employee turnover and compensation plans. Legal documents: Such as articles of incorporation, bylaws and any legal agreements the company has entered into.
What metrics are not worth presenting?
Vanity metrics should be avoided. These are statistics that are seemingly impressive and encouraging, but in reality do not reflect the actual success of the company. Some of such metrics are:
- Number of users: This is a popular metric that does not always reflect the value and engagement of users. The number of users can be inflated by fake accounts, inactive users or users who use the free version of the product, but do not translate into revenue for the company. It is better to focus on analyzing users who are paid subscribers or the number of users who are actually engaged and regularly use the product's key functionality.
- Number of app downloads: As with the number of users, the number of downloads can be misleading because not everyone who downloads an app uses it. Additionally, this metric says nothing about the revenue the app generates.
- Time spent on the site: A high time spent on the site may seem encouraging, but it actually says nothing about whether users are performing the actions the company wants, such as buying a product or registering on the site.
- Social media statistics: The number of likes, shares and comments on a company's page on social media may seem impressive, but in reality does not translate into revenue or brand value.
- Number of impressions: This metric can be misleading, as it says nothing about whether users have moved on to a specific action on the site, such as registering, downloading an e-book, making a purchase or filling out a contact form.
When preparing your Data Room, it makes sense to focus on metrics that truly reflect the value of your business and allow you to assess its potential to generate future profits and growth.
Why is Data Storytelling important?
In a Data Room, it's worth giving context to the data and building an appropriate narrative, as this makes it easier to understand the information presented and allows for faster and more accurate inferences. Data without context can be difficult to understand and interpret, and merely showing a few numbers and charts won't necessarily provide investors with a comprehensive understanding of the business. Proper data storytelling, on the other hand, allows you to show investors how a company achieves its business goals, what challenges it has and how it intends to turn them into success. This helps investors understand how a startup operates, what goals it has and what challenges it faces. It also helps to build a positive image of the company and convince investors of its potential. Variations in a startup's data should be explained. If we have introduced a feature to our product that has helped increase sales or user engagement, it is a good idea to tell about it. This way we will show the proficiency of our initiatives and the successes we have achieved. If the statistics show declines, it's good to show that the company understands why they occurred. They may be due to seasonality specific to our product, for example. It is good to highlight such factors. Even if they seem obvious to the company's managers. They may not be obvious to potential investors.
Is it possible to quickly build a Data Room of your own startup using the R programming language and the Shiny library?
Yes, it is possible to build your own Data Room using the R programming language and the Shiny library. Shiny is a tool that allows you to create interactive applications in R, so you can build an intuitive and easy-to-use interface. To build your own Data Room using Shiny, you must first create the appropriate connections to the databases from which you will retrieve and process data. For simplicity, in this article, sample data will be provided directly in the code. Depending on the needs of the company preparing the Data Room, you can directly connect to the database, or load the exported data as a CSV file. There are a number of libraries that make this possible. You can then create a Shiny application that will display selected metrics and information about the company, such as profit and loss statements, financial balance sheets, investor information and other important information. You can also add various tools in Shiny, such as filters, charts, tables and other elements that facilitate data visualization and analysis. Once the application is built, it can be made available to potential investors via secure login or other access control tools.
Investor Data Room in R Shiny - an example
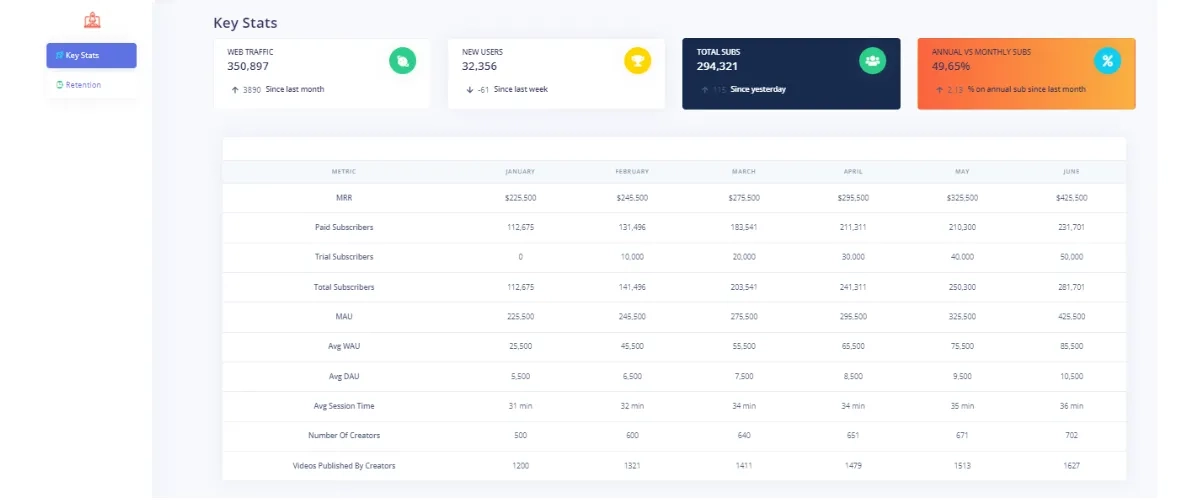
On my website www.startupdataguy.com you will find an example that can serve as inspiration for creating your own application. Startup Investor Data Room consists of two tabs. The first presents the most important metrics from the point of view of a given startup.

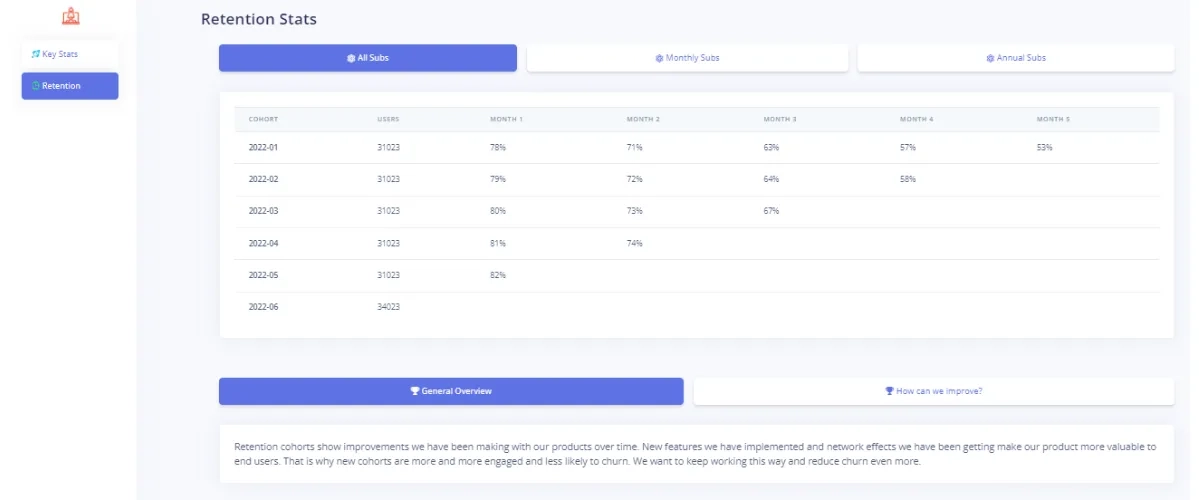
The second tab presents the retention cohorts and explanations that build the narrative - explaining the variability of the data presenting the conclusions of the analysis and the company's plan to improve the situation.
Libraries useful in building the application
library(shiny) library(argonR) library(argonDash) library(magrittr)
The sample application consists of four scripts:
app.R
This script creates an interactive application using the Shiny library in R. Here we define the name of the application and its description. Here we can import the libraries that will be needed in the application. In this example, three sources are defined: "sidebar.R", "keyStatsTab.R", "retentionTab.R". The "sidebar.R" file defines the sidebar, "keyStatsTab.R" defines the first tab, and "retentionTab.R" defines the second tab. The application is created using the "shinyApp" function, which consists of two arguments. The first argument is the user interface, which is defined using the "argonDashPage" function, and the second argument is the server, which is defined using the "server" function. The user interface consists of a description title, a sidebar and two tabs. The first tab contains the elements defined in the "keyStatsTab.R" file, and the second tab contains the elements defined in the "retentionTab.R" file.
source("sidebar.R") source("keyStatsTab.R") source("retentionTab.R") shiny::shinyApp( ui = argonDashPage( title = "Title", author = "Your Name", description = "Your Description", sidebar = argonSidebar, body = argonDashBody( argonTabItems( keyStatsTab, retentionTab ) ) ), server = function(input, output) {} )
sidebar.R
The file "sidebar.R" defines a sidebar, where we have a menu, where the "keyStats" and "retention" tabs are located. The script can look similar to this:
argonSidebar <- argonDashSidebar( vertical = TRUE, skin = "light", background = "white", size = "md", side = "left", id = "my_sidebar", brand_url = "Your Website Address", brand_logo = "Your Logo", dropdownMenus = argonDropNav( title = "Dropdown Menu", src = "Your Logo", orientation = "right", argonDropNavTitle(title = "Welcome!"), argonDropNavItem( title = "Item 1", src = "https://www.google.com", icon = argonIcon("single-02") ), argonDropNavItem( title = "Item 2", src = NULL, icon = argonIcon("settings-gear-65") ), argonDropNavDivider(), argonDropNavItem( title = "Item 3", src = "#", icon = argonIcon("calendar-grid-58") ) ),
  argonSidebarMenu( argonSidebarItem( tabName = "keyStats", icon = argonIcon(name = "spaceship", color = "info"), "Key Stats" ), argonSidebarItem( tabName = "retention", icon = argonIcon(name = "watch-time", color = "green"), "Retention" ) ) )
keyStatsTab.R
This script creates a "Key Stats" tab in the application, containing several tabs with business metrics and a table with revenue, subscription and website traffic data. The tabs use graphical elements, such as icons, to more easily visualize changes in each metric. The table shows revenue, subscription and other business metrics for each month, making it easy to track changes over time. An example of how to write such a script:
keyStatsTab <- argonTabItem( tabName = "keyStats", # info cards argonH1("Key Stats", display = 4), argonRow( argonInfoCard( value = "350,897", title = "WEB TRAFFIC", stat = 3890, stat_icon = icon("arrow-up"),
      description = "Since last month", icon = argonIcon("planet"), icon_background = "green", hover_lift = TRUE ), argonInfoCard( value = "32,356", title = "NEW USERS", stat = -61, stat_icon = icon("arrow-down"),
      description = "Since last week", icon = icon("trophy"), icon_background = "yellow", shadow = TRUE ), argonInfoCard( value = "294,321", title = "Total Subs", stat = 115, stat_icon = icon("arrow-up"),
      description = "Since yesterday", icon = icon("users"), icon_background = "green", background_color = "default" ), argonInfoCard( value = "49.65%", title = "Annual vs Monthly Subs", stat = 2.13, stat_icon = icon("arrow-up"), description = "% on annual sub since last month", icon = icon("percent"), icon_background = "info", gradient = TRUE, background_color = "orange", hover_lift = TRUE ), br(), br(), argonTable( cardWrap = TRUE, headTitles = c( "Metric", "January", "February", "March", "April",
      "May", "June" ), argonTableItems( argonTableItem("MRR"), argonTableItem(dataCell = TRUE, "$225,500"), argonTableItem(dataCell = TRUE, "$245,500"),
      argonTableItem(dataCell = TRUE, "$275,500"), argonTableItem(dataCell = TRUE, "$295,500"), argonTableItem(dataCell = TRUE, "$325,500"), argonTableItem(dataCell = TRUE, "$425,500") ) ) )
retentionTab.R
This script is responsible for the contents of the "Retention" tab. It allows you to analyze retention cohorts for different types of subscriptions offered by the startup (monthly subscriptions, annual subscriptions, all together). Under the table with retention cohorts, a brief explanation of the company's situation is presented, allowing you to build a narrative around the retention data.
Next steps
Depending on the business needs, the profile of the startup and the data the startup would like to make available to investors, the application can be developed in different directions. Here are some of them:
- Adding a login mechanism.
- Interactive charts.
- Additional metrics.
- A section with attachments.
- Adding video content to build narrative.
Summary
Data Room is a useful tool that can be very helpful in the process of raising funding for a startup. With little effort, you can build your own Data Room using the R programming language and the Shiny library. Here are training courses that can help you build similar applications:
- Fundamentals of programming in R
- Modern data processing in R
- Data visualization in R
- Creating applications with R Shiny
- Advanced programming with R
- Data analyst's workshop in R
- Reporting with R
- Data analysis in R