


Data storytelling is bringing data to life. It's a practical approach to building narratives and visually depicting dry data so that the meaning of the information contained in the data is conveyed to the audience in an easy and accessible way. The power of data storytelling lies in its appeal to the end user by dressing up numerical forms in the form of a story, which can be very persuasive and effective in its message.


Check out the postgraduate program Visual Data Analytics
Key Points:
- What are the four key skills to become a master of data storytelling?
- Why should you hone them?
- How do you perfect them?
First, I have good news for you. Any of us can be a master of data storytelling and master the necessary skills to a "good enough" degree. Of course, each of us, both by virtue of our innate talents and acquired experience, will start from a different level and the time it takes to achieve "good enough" skills will vary. There is scientific evidence that you need about 10,000 hours to be a professional in any chosen field, but only 20 hours to have a basic knowledge of a subject. Here are four basic skills that will help you thrive in data storytelling.
Analytical skills
These skills in data storytelling are the foundation of the basics. Without an understanding of numbers and the ease of interpreting them, it is impossible to properly craft a data story. Even if you are not a data analyst, i.e. someone who already possesses the ability to transform and interpret huge data sets, you can still learn.
Our brain is divided into two halves - left and right. The left half is responsible for analytical, logical and sequential thinking. The language center is located in this part of the brain. The right half gives us the ability to perceive in a non-verbal way: seeing objects in space, comparing similarities, intuition, and a holistic view of an issue. Most people experience the dominance of one of the halves. However, this does not determine whether a person is an artist or an accountant. If all people have both halves, then everyone can analyze and interpret data. Of course, some of us are more talented than others in this field, but I would be far from the opinion that you can't learn data analytics, provided you don't suffer from robust dyscalculia.
But where do you start your journey with data analytics if you have no prior experience?
First of all, understanding descriptive statistics changes the character of things. Descriptive statistics are methods of organizing and summarizing information. With these statistics prepared, we can start asking the right questions that will help us discover knowledge from the data and draw conclusions. In most cases, analytics is done to see trends in the data, the contribution of different factors or the distribution of one characteristic in the population.
Data visualization skills
We have collected all the necessary data, organized it and summarized it using descriptive statistics. But how to make them readable to others? In many companies, MS Excel is still the primary tool for reporting results. And still, in these companies, the primary way of presenting numerical data is an Excel table. There is nothing wrong with using tables, and sometimes they are even the best way to communicate results. However, we have many more tools to choose from to effectively communicate numbers. In any popular software such as Excel, Power BI or Tableau, we have an impressive array of data visualizations.
Visualizing numbers is a skill like any other. It can be learned and mastered. Nowadays, when we are immersed in an ocean of data, this skill is more necessary than ever. Data visualizations are often the only way to make sense of data, find patterns and understand the world around us. Data visualizations use human perception to communicate and receive data. If we do this without due care and consideration, our audiences will draw the wrong conclusions. The worst-case scenario would be to intentionally mislead the audience. One important aspect to keep in mind when communicating data is to act ethically with the audience. There are many sources that provide principles and best practices on how to use data visualization correctly. So don't miss this opportunity and earn your credibility.
Communication skills
The first two steps in the process have already been completed. You've found interesting patterns and insights in the data and prepared a visual representation of them. But how do you get that message across?
As a species, we are designed to communicate complex ideas and theories because we have a speech apparatus, unlike other animals. And vocal communication is the primary form for us. Thanks to our ability to communicate complex ideas and theories, we have built an advanced civilization. But even when we speak the same language, we often fail to articulate our thoughts effectively, and the recipient may misinterpret our message.
From a data storytelling perspective, there are two key elements of communication:
- Using language tailored to the audience. It is easy to overwhelm the audience with technical jargon, lose their attention and, as a result, their interest in the topic.
- Theability to explain complex issues in simple terms. When you explain your thoughts in a way that a seven-year-old child can understand, you are a master of communication. To achieve this, try to use as many comparisons, examples and metaphors from your listeners' experiences as possible.
Understanding the topic
In addition to these three essential skills in data storytelling, there is one more. I've already stressed several times how crucial it is to know your topic. As Steven Covey said, "first understand in order to be understood." You won't be a convincing storyteller without knowing what answers your audience is looking for. There is a simple rule: people are always interested in their issues and problems, not yours. Therefore, when you want to convince them, you need to present benefits or risks relevant to their perspective. In my experience, data analysts are overloaded with tasks related to ETL processes and do not have enough space to talk to business people about their pain points and challenges. Such conversations would greatly enrich the information provided. Data without context and an understanding of what is central to its delivery is useless.
In addition to mastering analytical, data visualization and communication skills, try to become a true partner to the business you support. Build strong relationships with internal or external customers and actively listen to them. Most people are willing to talk if they see that their listener is willing to listen to them. There is no better source of knowledge than subject matter experts**. By possessing these competencies, your ability to make a real impact in your organization and build your personal brand will grow.
From beginner to master of data storytelling
There are levels of mastery in every discipline. Data storytelling is no different. Find out where you are now and what your aspirations are.

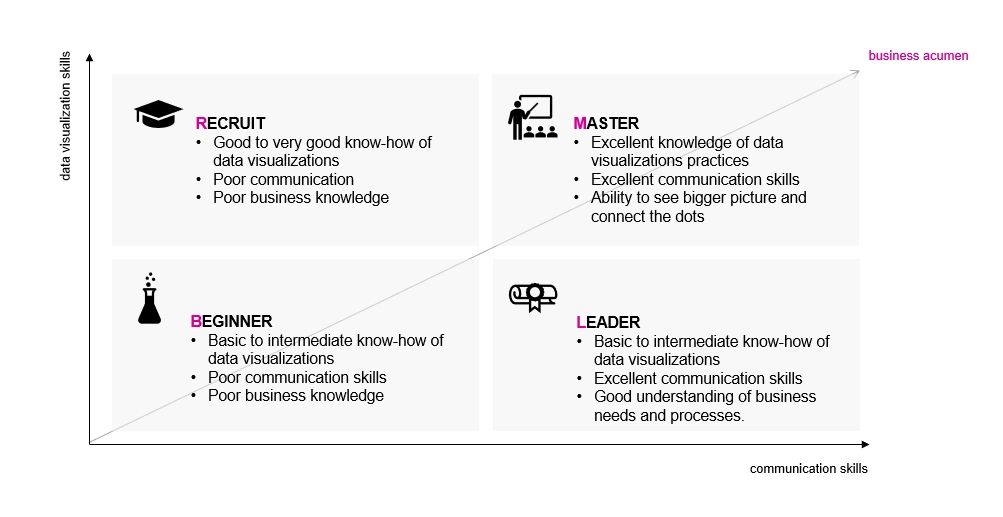
Beginner
This is the entry level. Often beginners are young people who are just starting out in data storytelling, but this is not the rule. There is plenty of theory in their heads, but they lack practice. Beginners should first of all deepen their business knowledge in order to prepare better and more accurate data analysis. In most organizations, there are plenty of internal trainings and materials that introduce internal business processes, rules and characteristics. And besides, you can always ask senior colleagues.
Recruiter
In my experience, I would include mostly data analysts with excellent analytical skills and data visualization skills who make beautiful data visualizations that, unfortunately, are often completely useless. The trap is that when you have experience in one very narrow specialty, you may have the illusion that you know better what others need and how to present it. This group should listen to the voice of its audience. Your audience may not be familiar with data analysis, but they certainly know what questions interest them and will show you which direction data analysis should go. Recruiters are typically data people who focus too much on the technical aspects and too often use very technical language when communicating with non-technical people. To improve their performance, they should focus more on the business side of analysis and less on the analysis itself.
Leader
As you can see from the matrix above, I value communication and business skills more than data visualization skills in data storytelling. People who already know what the pain points of the business are and can capture the attention of the audience do not need to know advanced data visualization techniques to make an impact. However, there is a potential risk of easily misleading audiences if one uses data without adequate knowledge of data visualization best practices. As I mentioned earlier, data visualization techniques rely on human perception, which is a very fragile cognitive apparatus. Leaders have a special mission in spreading a data culture in an organization because they feel comfortable with data, know how to use and present it, and through their position can make or influence data-driven decisions.
Champion
Champions are proficient in all four skills. What's more, by combining business knowledge with analytical skills, they are true advisors who can set the direction for development.
If you want to acquire a set of competencies in the application of data visualization in analytics, effective communication of analytical results and business decision-making, check out the postgraduate program at the Warsaw University of Technology, majoring in Visual Data Analytics.